
In this article
Announcements
Real-time analytics debugging, connected to your tracking plan
Introducing the Inspector Debugger, that brings real-time validation to every team, whether or not they use Codegen
Open your dev build, click around, and see immediately whether every event matches the tracking plan on your branch. That's the Inspector debugger.
It's also part of a bigger shift we're working on: to equip your coding agents with the tools they need to ship reliable tracking with every feature release. Our MCP is a few weeks away, it'll let AI coding tools pull tracking specs and issues directly from your tracking plan. The Inspector debugger is the validation piece of that puzzle.
Analytics debugging is still too manual
Modern tracking breaks in a lot of places.
Definitions get fuzzy or drift as the product changes. Two teams read the same spec and implement different things. Implementation bugs happen: a typo, a missing property or wrong property value.
The annoying thing is analytics rarely fails loudly. It fails quietly, and you usually find out when dashboards start looking suspicious.
Most teams end up debugging by staring at network requests and logs, comparing what was sent against scattered docs, screenshots, tickets, or just memory. Even when you find the payload, it's not always obvious what it should have been.
Avo addresses a lot of this: versioned tracking plan changes, branch-based review, implementation prompts and code snippets. And with Avo codegen, you get generated code with strong in-app debugging, especially on web.
But for teams not using Avo Codegen everywhere, a gap has remained. In dev and staging, validation still falls back to the browser network tab or a third-party tool. Those tools show you what was sent, but they're not connected to your tracking plan and they don't know what branch you're working on. On mobile, you're dealing with an emulator or a tethered device, plus extra tooling just to inspect events.
It adds up to a workflow nobody loves. Developers skip validation because it's slow and awkward. Data designers know mistakes slip through but rarely have time to QA things themselves. And it's not equally accessible. Data designers usually need a developer to set up a dev build before they can check anything. By the time issues surface, the data has already shipped.
Introducing the Inspector debugger
The Inspector debugger brings session-based, real-time validation to dev and staging.
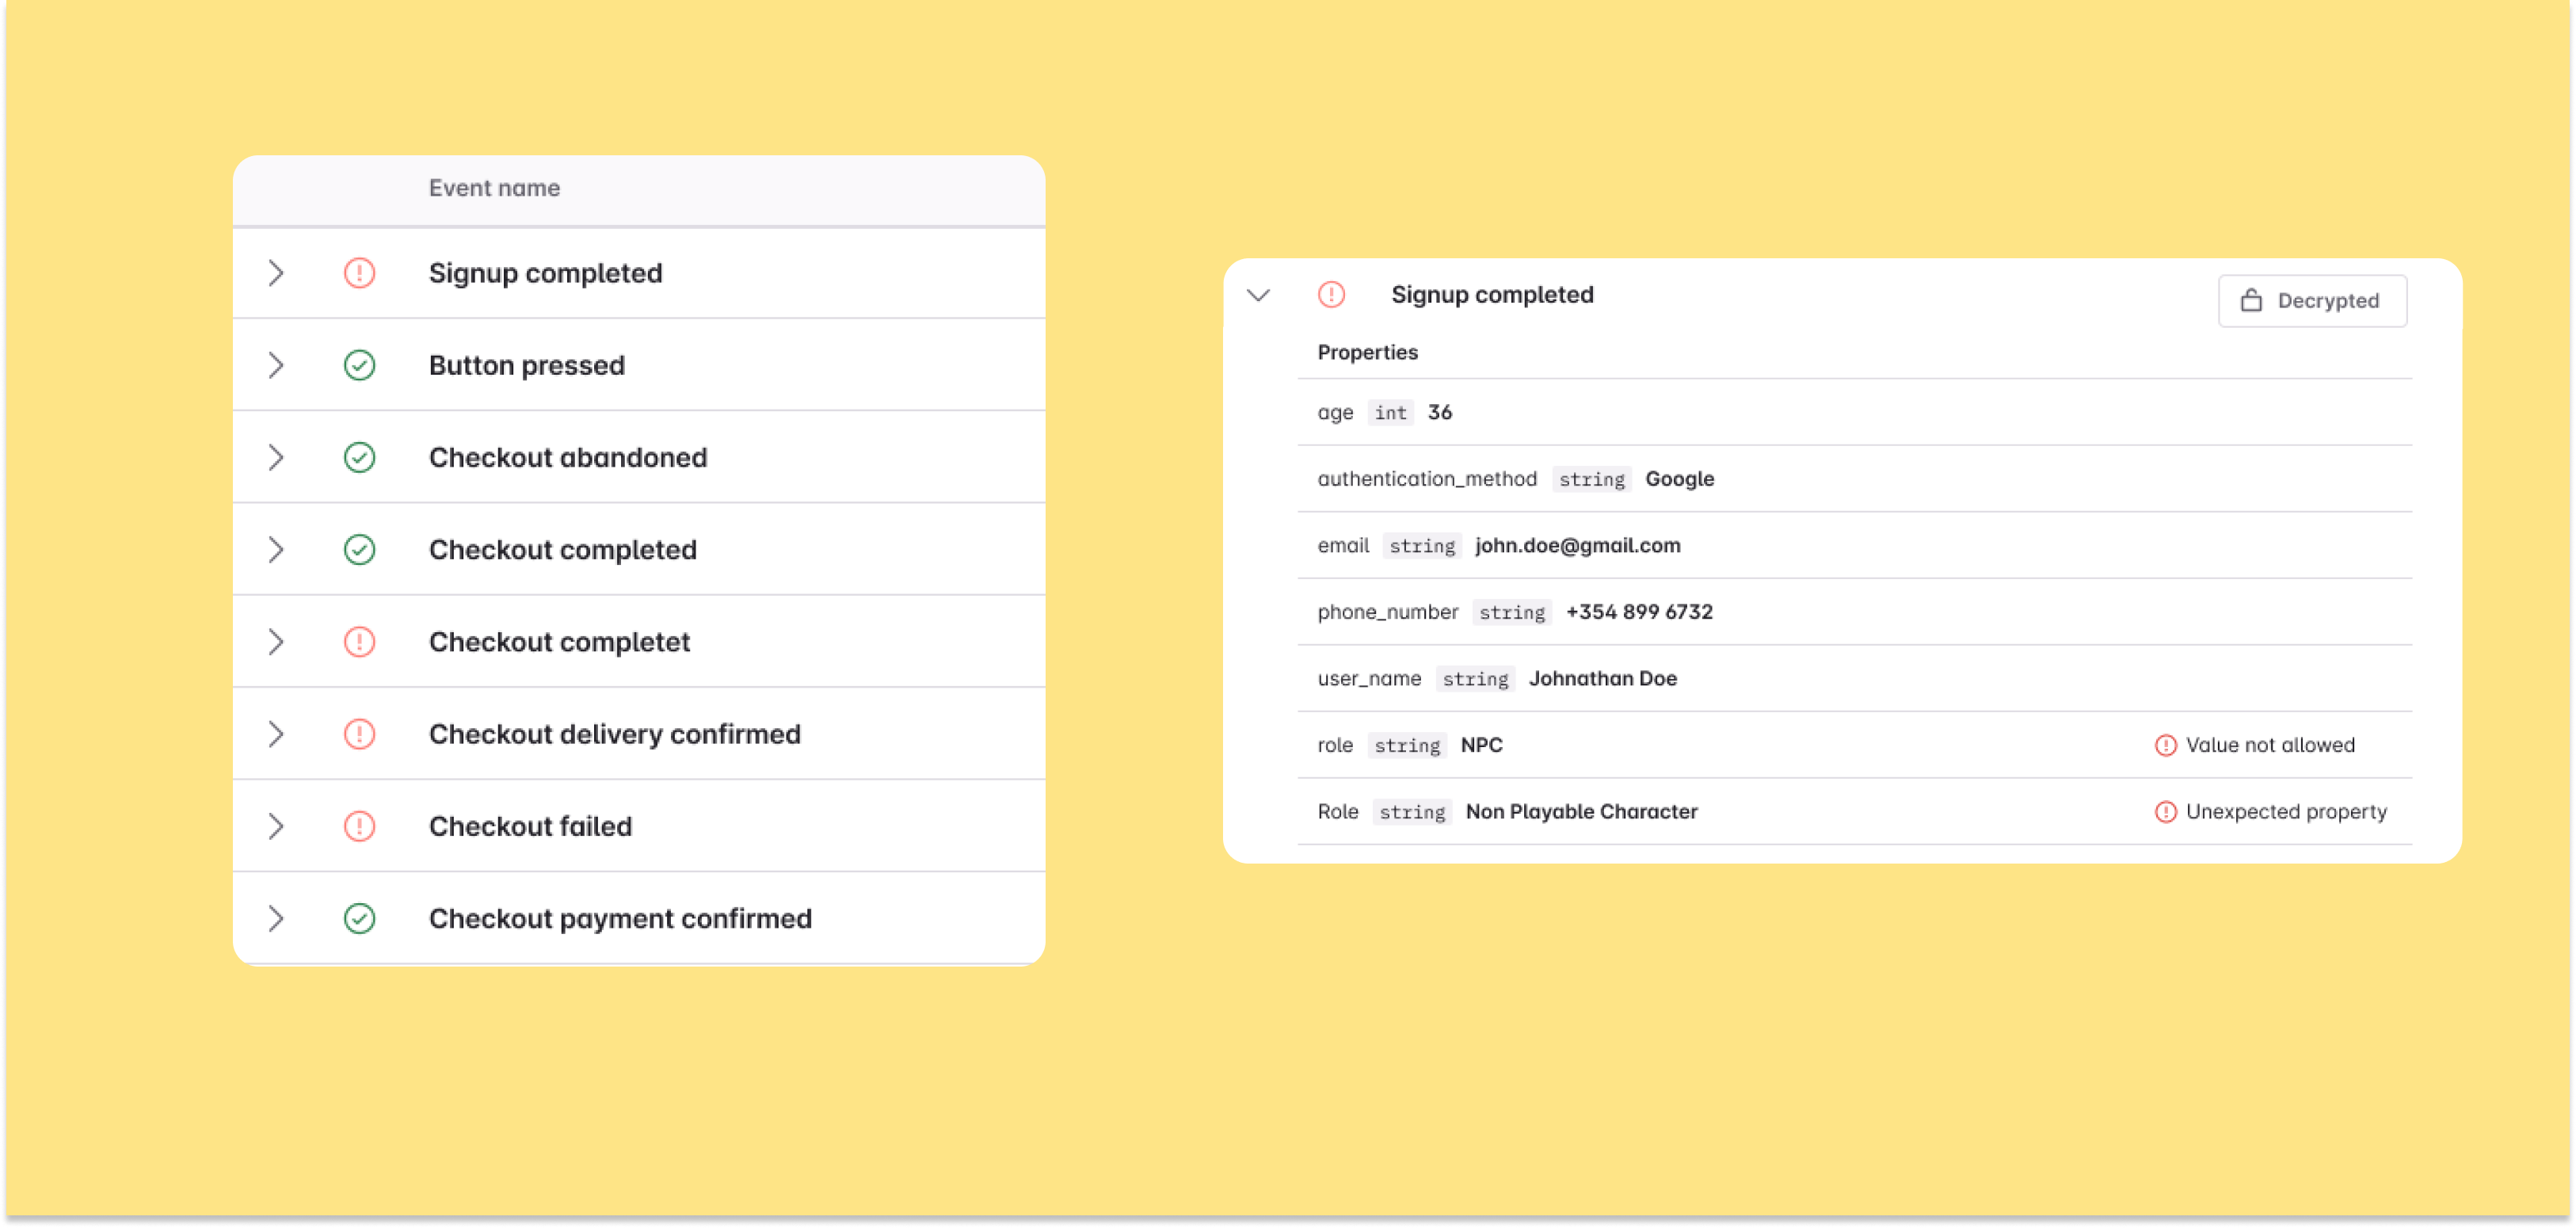
It streams events from your app and compares them against a specific branch of your tracking plan as they come in. When you open your app and start clicking around, Inspector assigns a human-readable stream ID to your session. Filter by that ID in the debugger dashboard to see only your events, then answer the question directly: is this build following the tracking plan we designed on this branch?
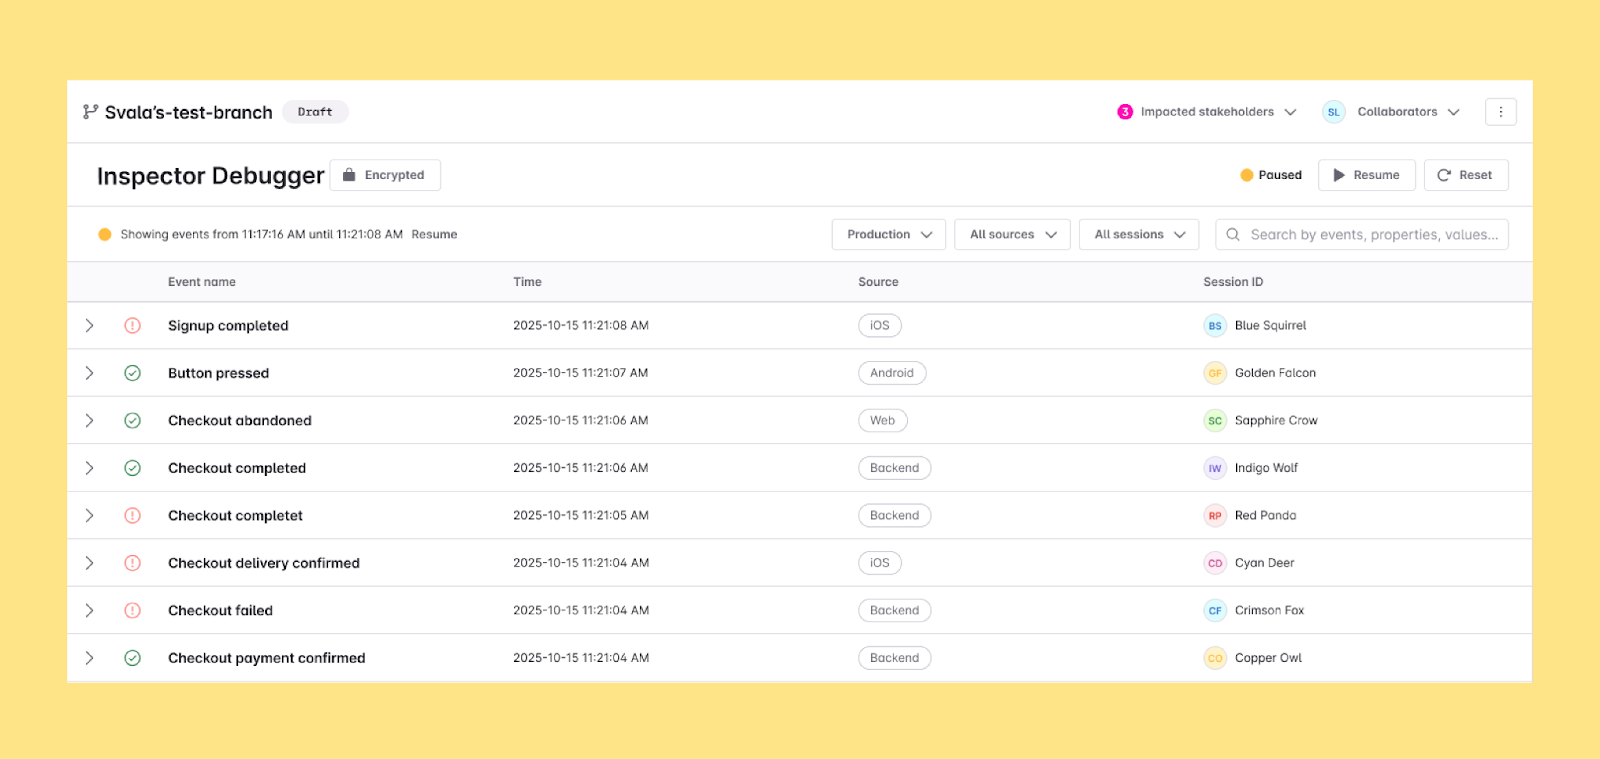
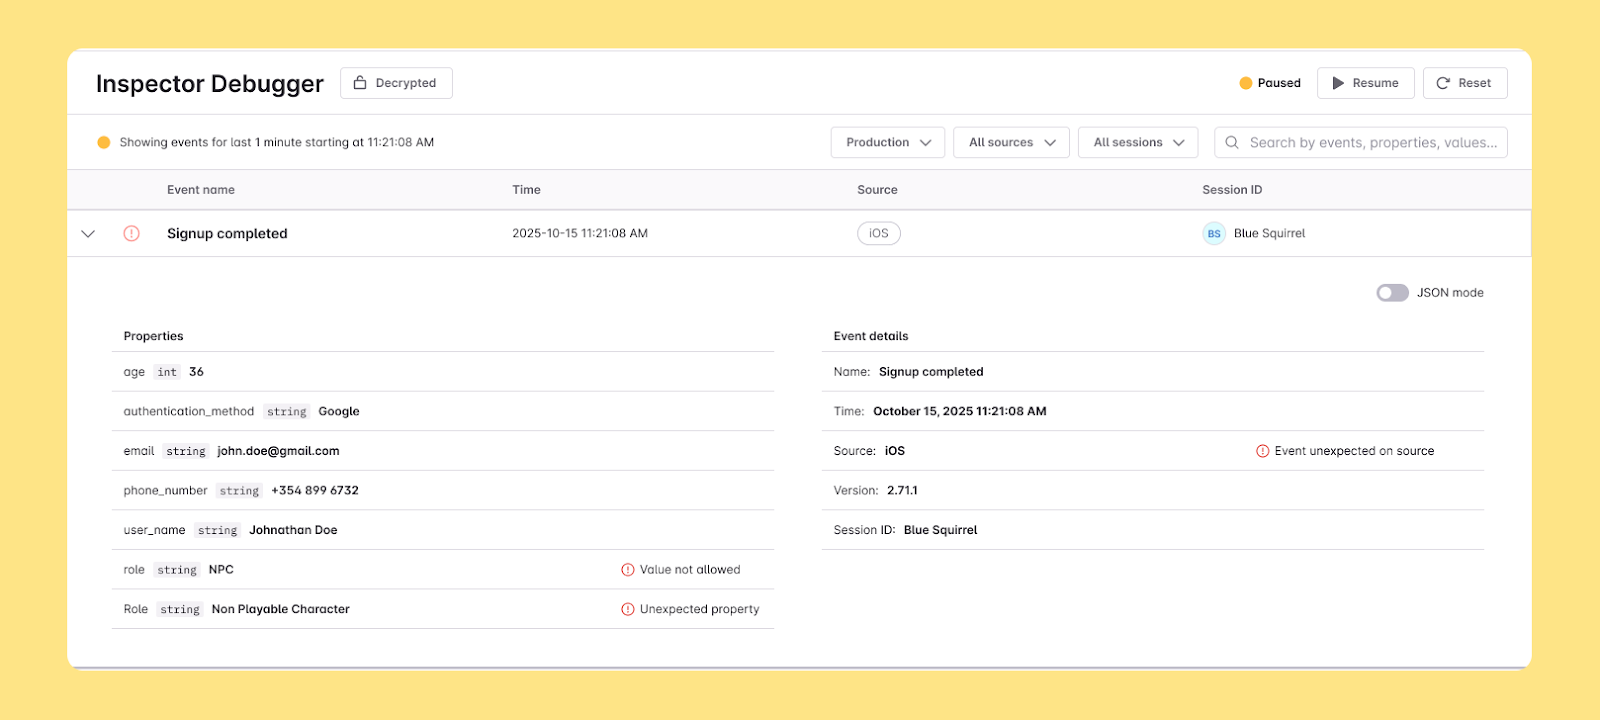
When something's off, Inspector shows you exactly what needs fixing: missing properties, wrong types, unexpected values, or events that no longer match after recent tracking plan changes. No manual comparisons. You can see which events pass, which don't, and what needs to change, while you're still in the build.
We were able to uncover system properties at the platform level that were never enabled, something we hadn't caught in the past. It's a really big impact change, and it's thanks to Avo that we caught it.
– Ursula Llaveria, Senior Data Warehouse Engineer at BILL
Prefer video? Watch a 2-minute walkthrough of the Inspector debugger in action.
Property value validation, without collecting user data
Value validation happens on the device.
When Inspector catches a property value issue, it creates the issue locally and sends it to Avo without the actual values. Avo stores the data shape and what went wrong — not the values themselves.
If you want to see which value caused a problem, you can provide an encryption key. Inspector will send encrypted values that only you can decrypt locally. Avo can't read them.
So you get real debugging details without Avo ever seeing the raw values.
How to get started
If you have Inspector running in dev or staging, you have access to the debugger now. To use session filtering and property value validation, update to the latest version of Inspector. You'll know you're on the right version when the stream ID and value issues show up in the debugger view.
New to Inspector? Get your first live debugging session running in a few steps:
- Install or upgrade Inspector in your dev or staging environment.
- Open the Inspector debugger in your Avo workspace.
- Run your app in dev or staging and start a session.
- Filter by environment and stream ID to focus on your session.
- Watch events stream in and fix issues as they appear.
Admins and editors can start immediately. Viewers can use the debugger if implementer seats are available; if not, an admin can add seats or upgrade the plan.
Full setup details, including encrypted value configuration, are in the Inspector debugger docs.
Block Quote